> ## Documentation Index
> Fetch the complete documentation index at: https://docs.orbitrage.ai/llms.txt
> Use this file to discover all available pages before exploring further.
# The Intelligence layer
> Always-on anomaly detection, root-cause trajectories, and on-demand explanations.
The Intelligence layer turns raw telemetry into answers. It runs statistical
detectors over your traffic continuously, reconstructs *why* something broke,
and — only when you ask — narrates the incident in plain language. Every finding
is **deterministic and auditable**: the LLM narrative explains the numbers, it
never invents them.
## Three layers, increasing depth
Always-on. Ranked anomalies across cost, latency, errors, and refusals — each
with a cause hypothesis and a confidence score.
On drill-down. Reconstructs the actual run graph: which node broke first and
how the failure propagated downstream.
On click. An LLM reads the computed facts and writes a short narrative with a
recommended fix. Cached, so idle costs nothing.
## What the detectors measure
Each metric uses the statistically appropriate test, not a one-size-fits-all
threshold. You don't need the math to read the dashboard:
| Signal | Method | Reads as |
| --------------------------------- | ----------------------------------- | --------------------------------------------------------------------------------------------- |
| **Latency / cost / token spikes** | Robust z-score (median + MAD) | "Far above the workflow's normal range." Immune to one-off outliers. |
| **Error / refusal rate change** | Two-proportion test + Wilson 95% CI | "The failure rate genuinely rose, not just noise." Confirmed only when the CIs don't overlap. |
| **Volume / error-count spikes** | Poisson or Negative-Binomial | "More calls/errors than expected" — won't cry wolf on bursty-but-normal traffic. |
| **Finish-reason drift** | Jensen-Shannon divergence | "The mix of stop / length / content-filter outcomes shifted." |
| **Cost movement** | Shapley decomposition | "Spend rose X% — here's how much was volume vs. price." |
Baselines are computed per **hour-of-week**, so a Tuesday-3pm spike is judged
against past Tuesday 3pms — not a flat weekly average.
### Severity
Findings are graded by significance **and** effect size **and** sample size:
* **Critical** — strong evidence, large effect, enough data.
* **Warning** — significant but smaller or less certain.
* **Info** — borderline or low-sample; worth a glance.
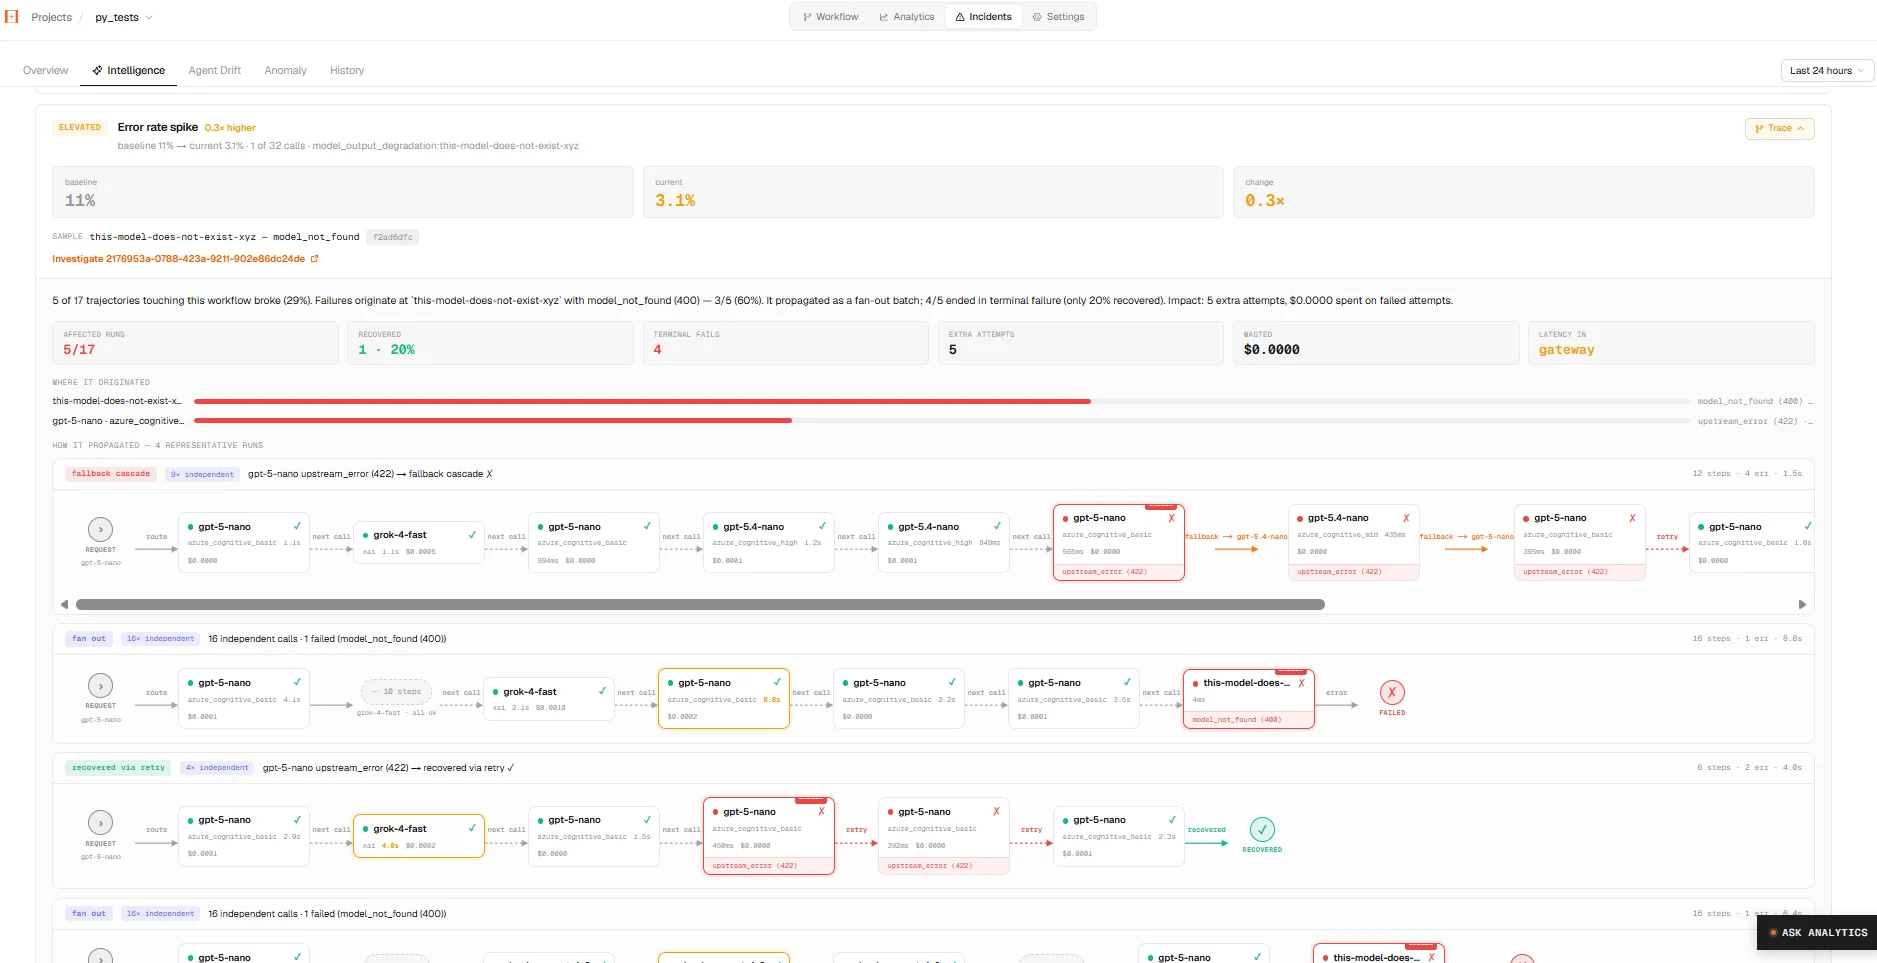
## Root-cause trajectories
Click a finding to open its **trajectory**. Orbitrage reconstructs the execution
graph of the affected runs — linking parent calls to child calls by explicit
trace ids, and, where those are missing, by content overlap between one call's
output and the next call's input. From that graph it computes:
* **First broken node** — the earliest step whose outcome was a failure, timeout,
empty response, or refusal.
* **Propagation path** — the downstream steps that degraded *because* of it.
* **Bottleneck** — the step on the critical path that ate the most time.
* **Recovery rate** — how many affected runs the fallback chain saved.
* **Impact** — affected sessions, wasted cost, and extra retries, summed exactly
from the data.
Representative run graphs are shown so you can *see* the cascade, not just read a
summary.
 ## Explain (the LLM narrative)
The **Explain** button asks a model (routed through Orbitrage itself) to turn the
already-computed facts into a short narrative and a recommended action — for
example:
> The Research node (`claude-sonnet`) is timing out on 61% of requests since
> 14:00 — a provider-side regression. The downstream Writer then gets empty
> context and refuses. Routing recovers 70% via fallback to `gpt-oss-20b`, but
> 38 runs still fail. Fix: route Research to a faster model; check the provider's
> status page.
Because it only runs on click and is cached (\~30 min), an idle dashboard spends
**zero** LLM tokens on explanations.
## Where it shows up
* The **Intelligence** tab in a workflow surfaces live findings and trajectories.
* The **Overview** page shows org-wide anomalies and incident KPIs.
* The [Ask Analytics assistant](/platform/ask-analytics) can run the same anomaly
detection on demand (`detect_anomalies`, `node_drift`).
* [Anomaly alerts](/platform/alerts) push breaches to Slack automatically.
The Intelligence layer is **descriptive** — it tells you what is happening and
why, with exact numbers. It does not auto-remediate; recommendations are
advisory.
## Explain (the LLM narrative)
The **Explain** button asks a model (routed through Orbitrage itself) to turn the
already-computed facts into a short narrative and a recommended action — for
example:
> The Research node (`claude-sonnet`) is timing out on 61% of requests since
> 14:00 — a provider-side regression. The downstream Writer then gets empty
> context and refuses. Routing recovers 70% via fallback to `gpt-oss-20b`, but
> 38 runs still fail. Fix: route Research to a faster model; check the provider's
> status page.
Because it only runs on click and is cached (\~30 min), an idle dashboard spends
**zero** LLM tokens on explanations.
## Where it shows up
* The **Intelligence** tab in a workflow surfaces live findings and trajectories.
* The **Overview** page shows org-wide anomalies and incident KPIs.
* The [Ask Analytics assistant](/platform/ask-analytics) can run the same anomaly
detection on demand (`detect_anomalies`, `node_drift`).
* [Anomaly alerts](/platform/alerts) push breaches to Slack automatically.
The Intelligence layer is **descriptive** — it tells you what is happening and
why, with exact numbers. It does not auto-remediate; recommendations are
advisory.