> ## Documentation Index
> Fetch the complete documentation index at: https://docs.orbitrage.ai/llms.txt
> Use this file to discover all available pages before exploring further.
# Dashboard tour
> What each page of the Orbitrage dashboard shows you.
The dashboard at [app.orbitrage.ai](https://app.orbitrage.ai) organizes everything around three levels — **Organization**, **Workflow**, and **End-user** — so you can zoom from "total spend this month" down to "what one customer's agent did on one run."
## Overview
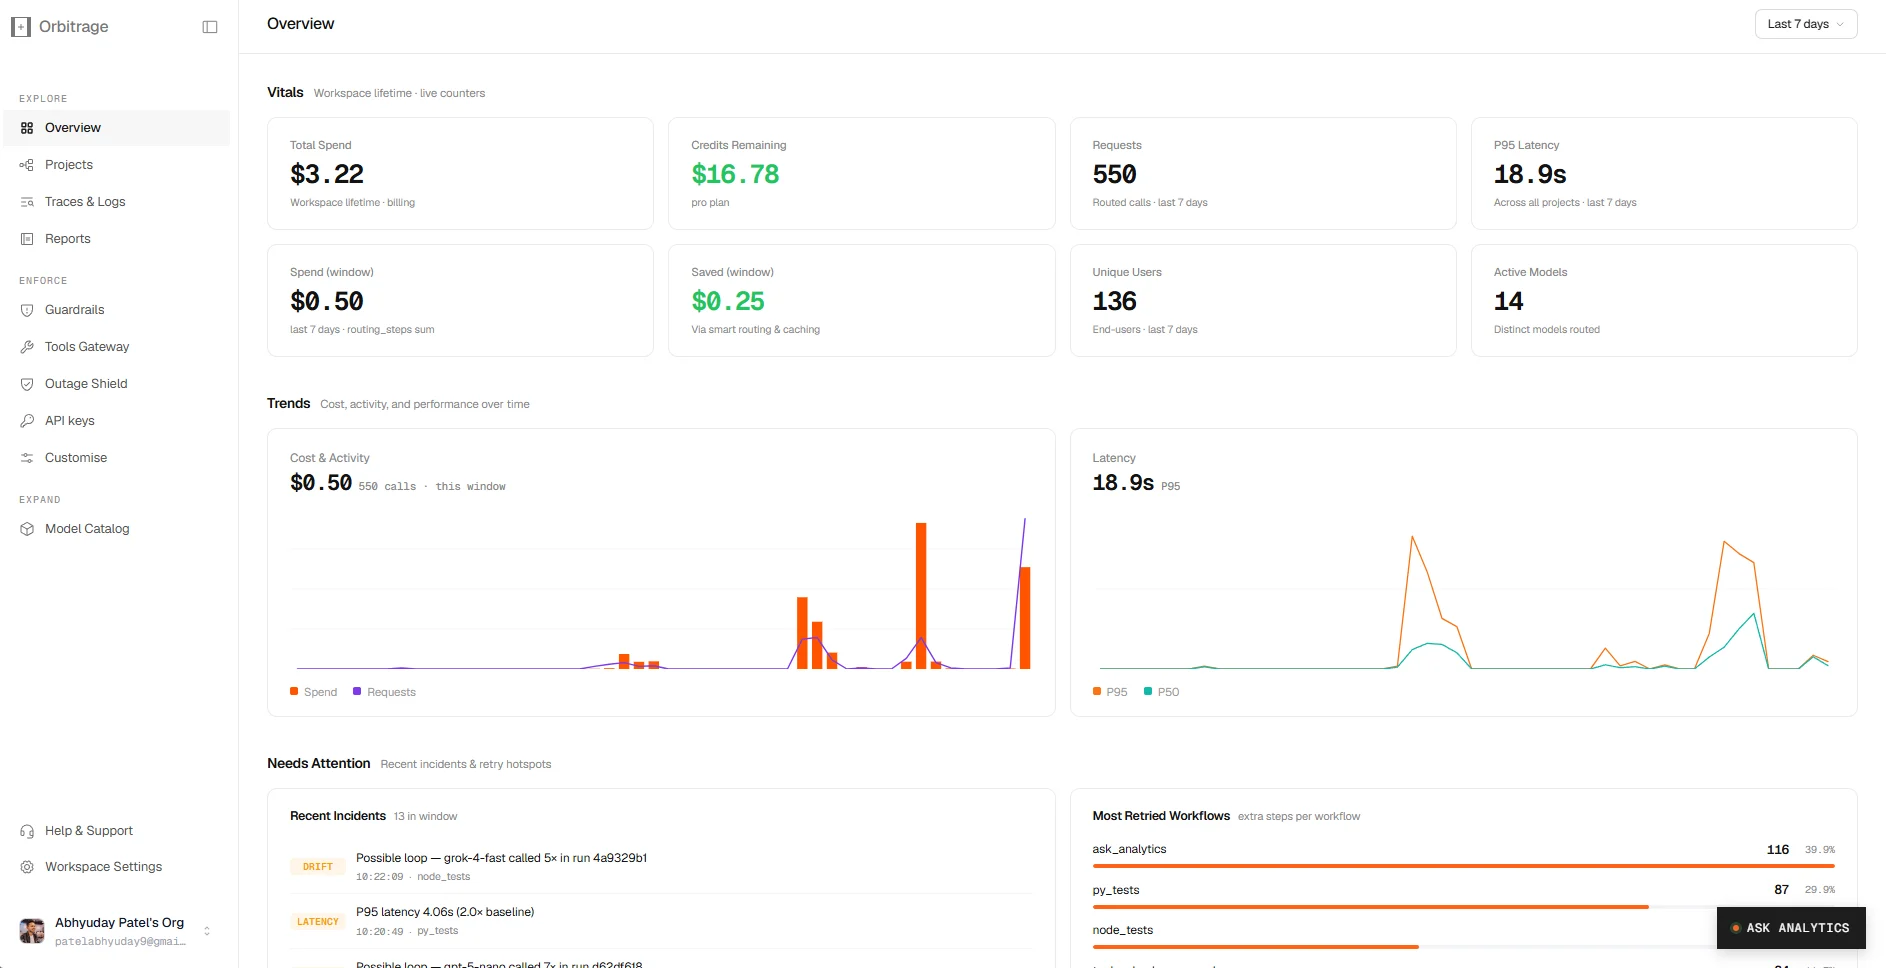
Your org-wide home page: headline KPIs (calls, cost, savings, incidents), cost-trend with anomaly markers, and per-project health. Start here to see whether anything needs attention.
 ## Workflows
A **workflow** is a project — every API key belongs to one. The list shows runs/month, incidents, cost, and status (running / paused / degraded) per project, and lets you create new ones.
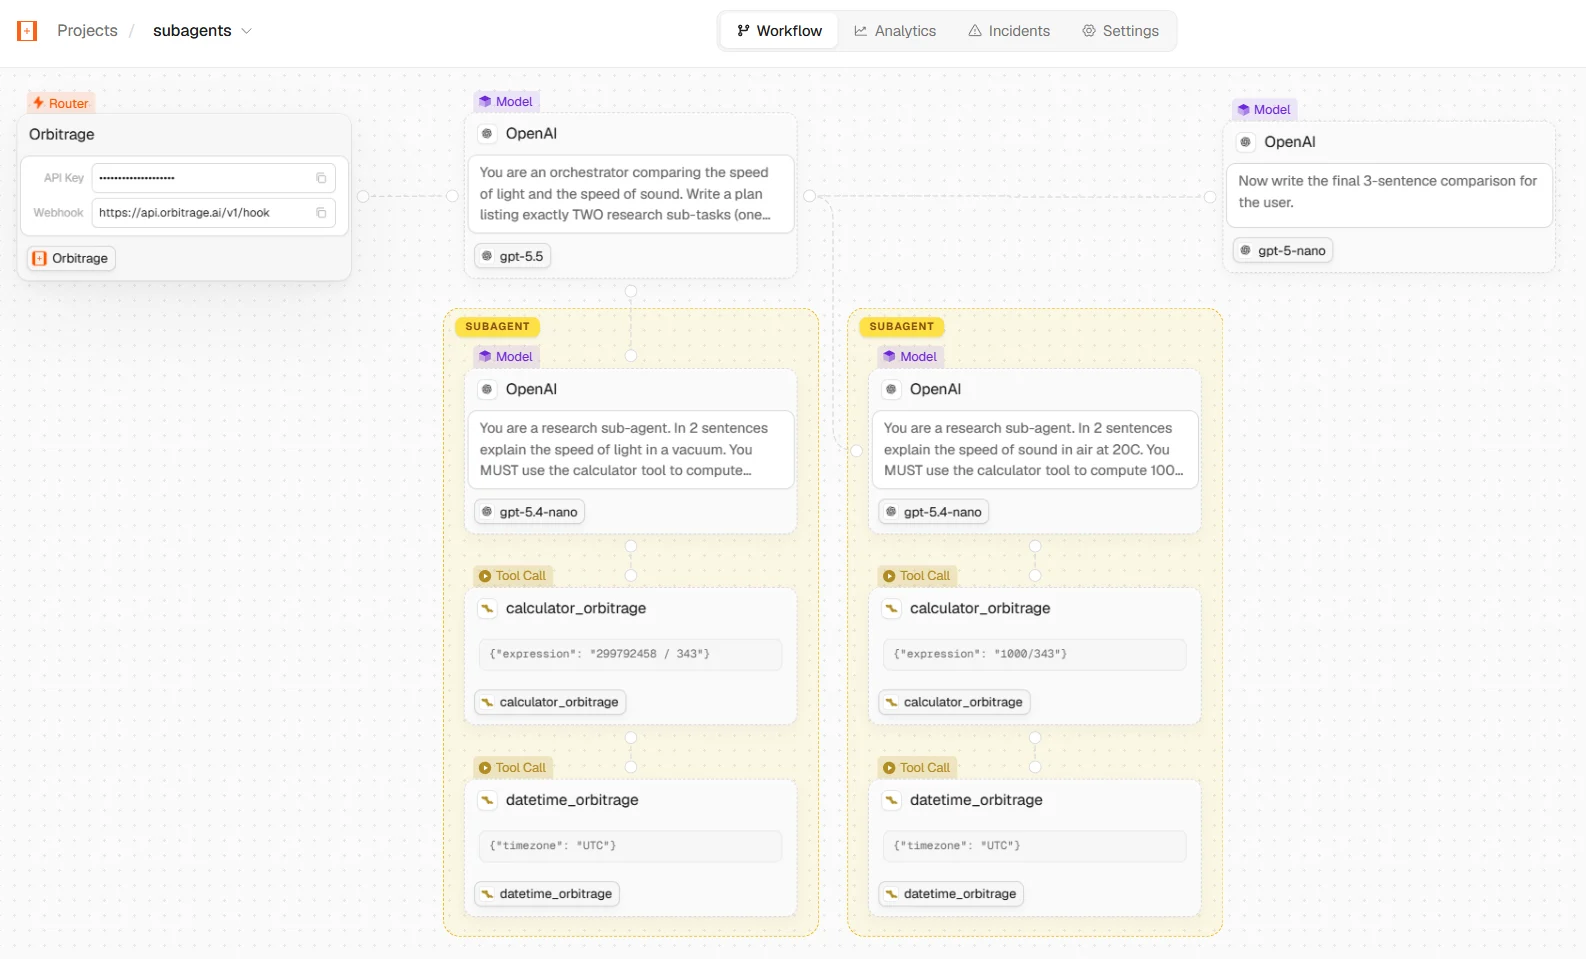
Open a workflow to get its **flow graph**: an interactive reconstruction of each run, with a node per LLM call and tool invocation. Click a node for messages, model, tokens, cost, latency, routing signals, and fallback chain. The detail page also has tabs for **Analytics**, **Incidents**, **Intelligence**, and **Settings**.
## Workflows
A **workflow** is a project — every API key belongs to one. The list shows runs/month, incidents, cost, and status (running / paused / degraded) per project, and lets you create new ones.
Open a workflow to get its **flow graph**: an interactive reconstruction of each run, with a node per LLM call and tool invocation. Click a node for messages, model, tokens, cost, latency, routing signals, and fallback chain. The detail page also has tabs for **Analytics**, **Incidents**, **Intelligence**, and **Settings**.
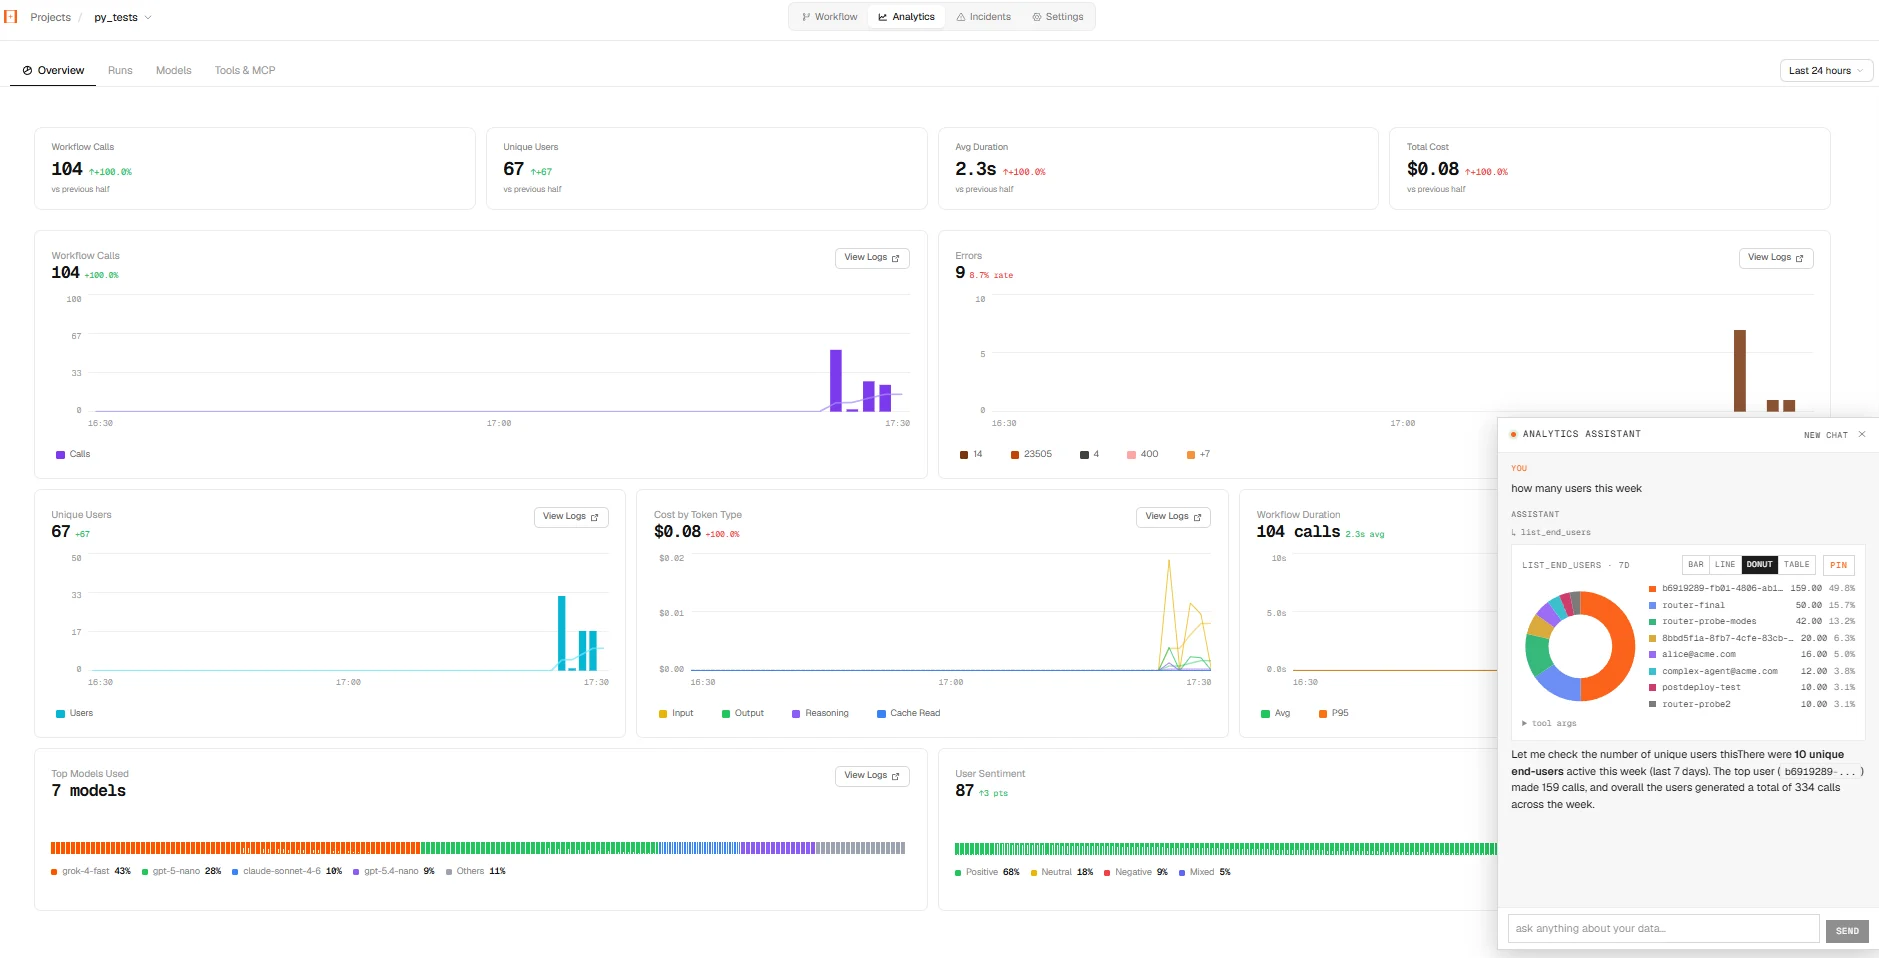
 The **Analytics** tab breaks down calls, unique users, cost by token type, top models, and (inferred) user sentiment — with an Ask-Analytics assistant for ad-hoc questions:
 ## Routing
Every router decision, live. A sortable table of calls — requested model, routed model, tier, tokens, latency, cost, savings — plus charts for cost/latency per call, model distribution, and tier breakdown. Click any row for the full routing detail, including the score and the signals that drove it.
## Telemetry & Traces
* **Telemetry** — the live span stream from your calls, with per-span detail (trace id, provider, tokens/sec, baseline cost) and org-wide totals including "what you'd save with the router."
* **Traces** — an org-wide drilldown across all workflows by Requests, Errors, Models, and Tools.
## The three insight clusters
Within Overview and each workflow, analytics group into:
Daily spend with anomaly detection, trend forecast, cost composition, a money-flow view, an hour-of-day heatmap, and top models / providers / users.
The routing matrix, context-window distribution, run shapes, a tool leaderboard with co-occurrence, and end-user similarity.
Per-provider error rates with confidence intervals, daily error series, refusal & truncation rates, and finish-reason drift.
## Models
Browse the routable catalog with per-model pricing and tier, test any model in a chat modal, and manage [BYOK](/concepts/byok) provider keys — including a 30-day BYOK spend tracker and an org-level "fall back to pooled on BYOK failure" toggle. Frontier models (`claude-*`, `gpt-*`, `gemini-*`, `grok-*`) are badged **BYOK required** and greyed out with an **Add key** action until you save and enable a key for that vendor.
## Router
Benchmark a sample of your real production traffic against cheaper (or better) models and switch the ones that hold your accuracy — replay, LLM-judge, and a trustworthy recommendation gate. See [Router](/dashboard/router).
## Keys, Billing, Settings
* **Keys** — mint, list, and revoke [API keys](/account/api-keys) (each scoped to a workflow).
* **Billing** — credit balance, usage, and top-ups. See [Billing](/account/billing).
* **Customise** — manage [webhook alerts](/platform/alerts), pinned charts, MCP keys, and the [Slack](/platform/slack) connection.
* **Settings / Workspace / Orgs** — profile, organization settings, and switching between organizations.
Prefer chat? Almost everything here — analytics, projects, keys, alerts — can also be driven from [Slack](/platform/slack) or [Ask Analytics](/platform/ask-analytics) without opening the dashboard.
## Routing
Every router decision, live. A sortable table of calls — requested model, routed model, tier, tokens, latency, cost, savings — plus charts for cost/latency per call, model distribution, and tier breakdown. Click any row for the full routing detail, including the score and the signals that drove it.
## Telemetry & Traces
* **Telemetry** — the live span stream from your calls, with per-span detail (trace id, provider, tokens/sec, baseline cost) and org-wide totals including "what you'd save with the router."
* **Traces** — an org-wide drilldown across all workflows by Requests, Errors, Models, and Tools.
## The three insight clusters
Within Overview and each workflow, analytics group into:
Daily spend with anomaly detection, trend forecast, cost composition, a money-flow view, an hour-of-day heatmap, and top models / providers / users.
The routing matrix, context-window distribution, run shapes, a tool leaderboard with co-occurrence, and end-user similarity.
Per-provider error rates with confidence intervals, daily error series, refusal & truncation rates, and finish-reason drift.
## Models
Browse the routable catalog with per-model pricing and tier, test any model in a chat modal, and manage [BYOK](/concepts/byok) provider keys — including a 30-day BYOK spend tracker and an org-level "fall back to pooled on BYOK failure" toggle. Frontier models (`claude-*`, `gpt-*`, `gemini-*`, `grok-*`) are badged **BYOK required** and greyed out with an **Add key** action until you save and enable a key for that vendor.
## Router
Benchmark a sample of your real production traffic against cheaper (or better) models and switch the ones that hold your accuracy — replay, LLM-judge, and a trustworthy recommendation gate. See [Router](/dashboard/router).
## Keys, Billing, Settings
* **Keys** — mint, list, and revoke [API keys](/account/api-keys) (each scoped to a workflow).
* **Billing** — credit balance, usage, and top-ups. See [Billing](/account/billing).
* **Customise** — manage [webhook alerts](/platform/alerts), pinned charts, MCP keys, and the [Slack](/platform/slack) connection.
* **Settings / Workspace / Orgs** — profile, organization settings, and switching between organizations.
Prefer chat? Almost everything here — analytics, projects, keys, alerts — can also be driven from [Slack](/platform/slack) or [Ask Analytics](/platform/ask-analytics) without opening the dashboard.